Your workbook,
formulas wired.
Four jobs the analyst already does on Tuesday morning. The workspace handles each one in your shape, not a generic one.
Re-run a DCF on the latest 10-Q.
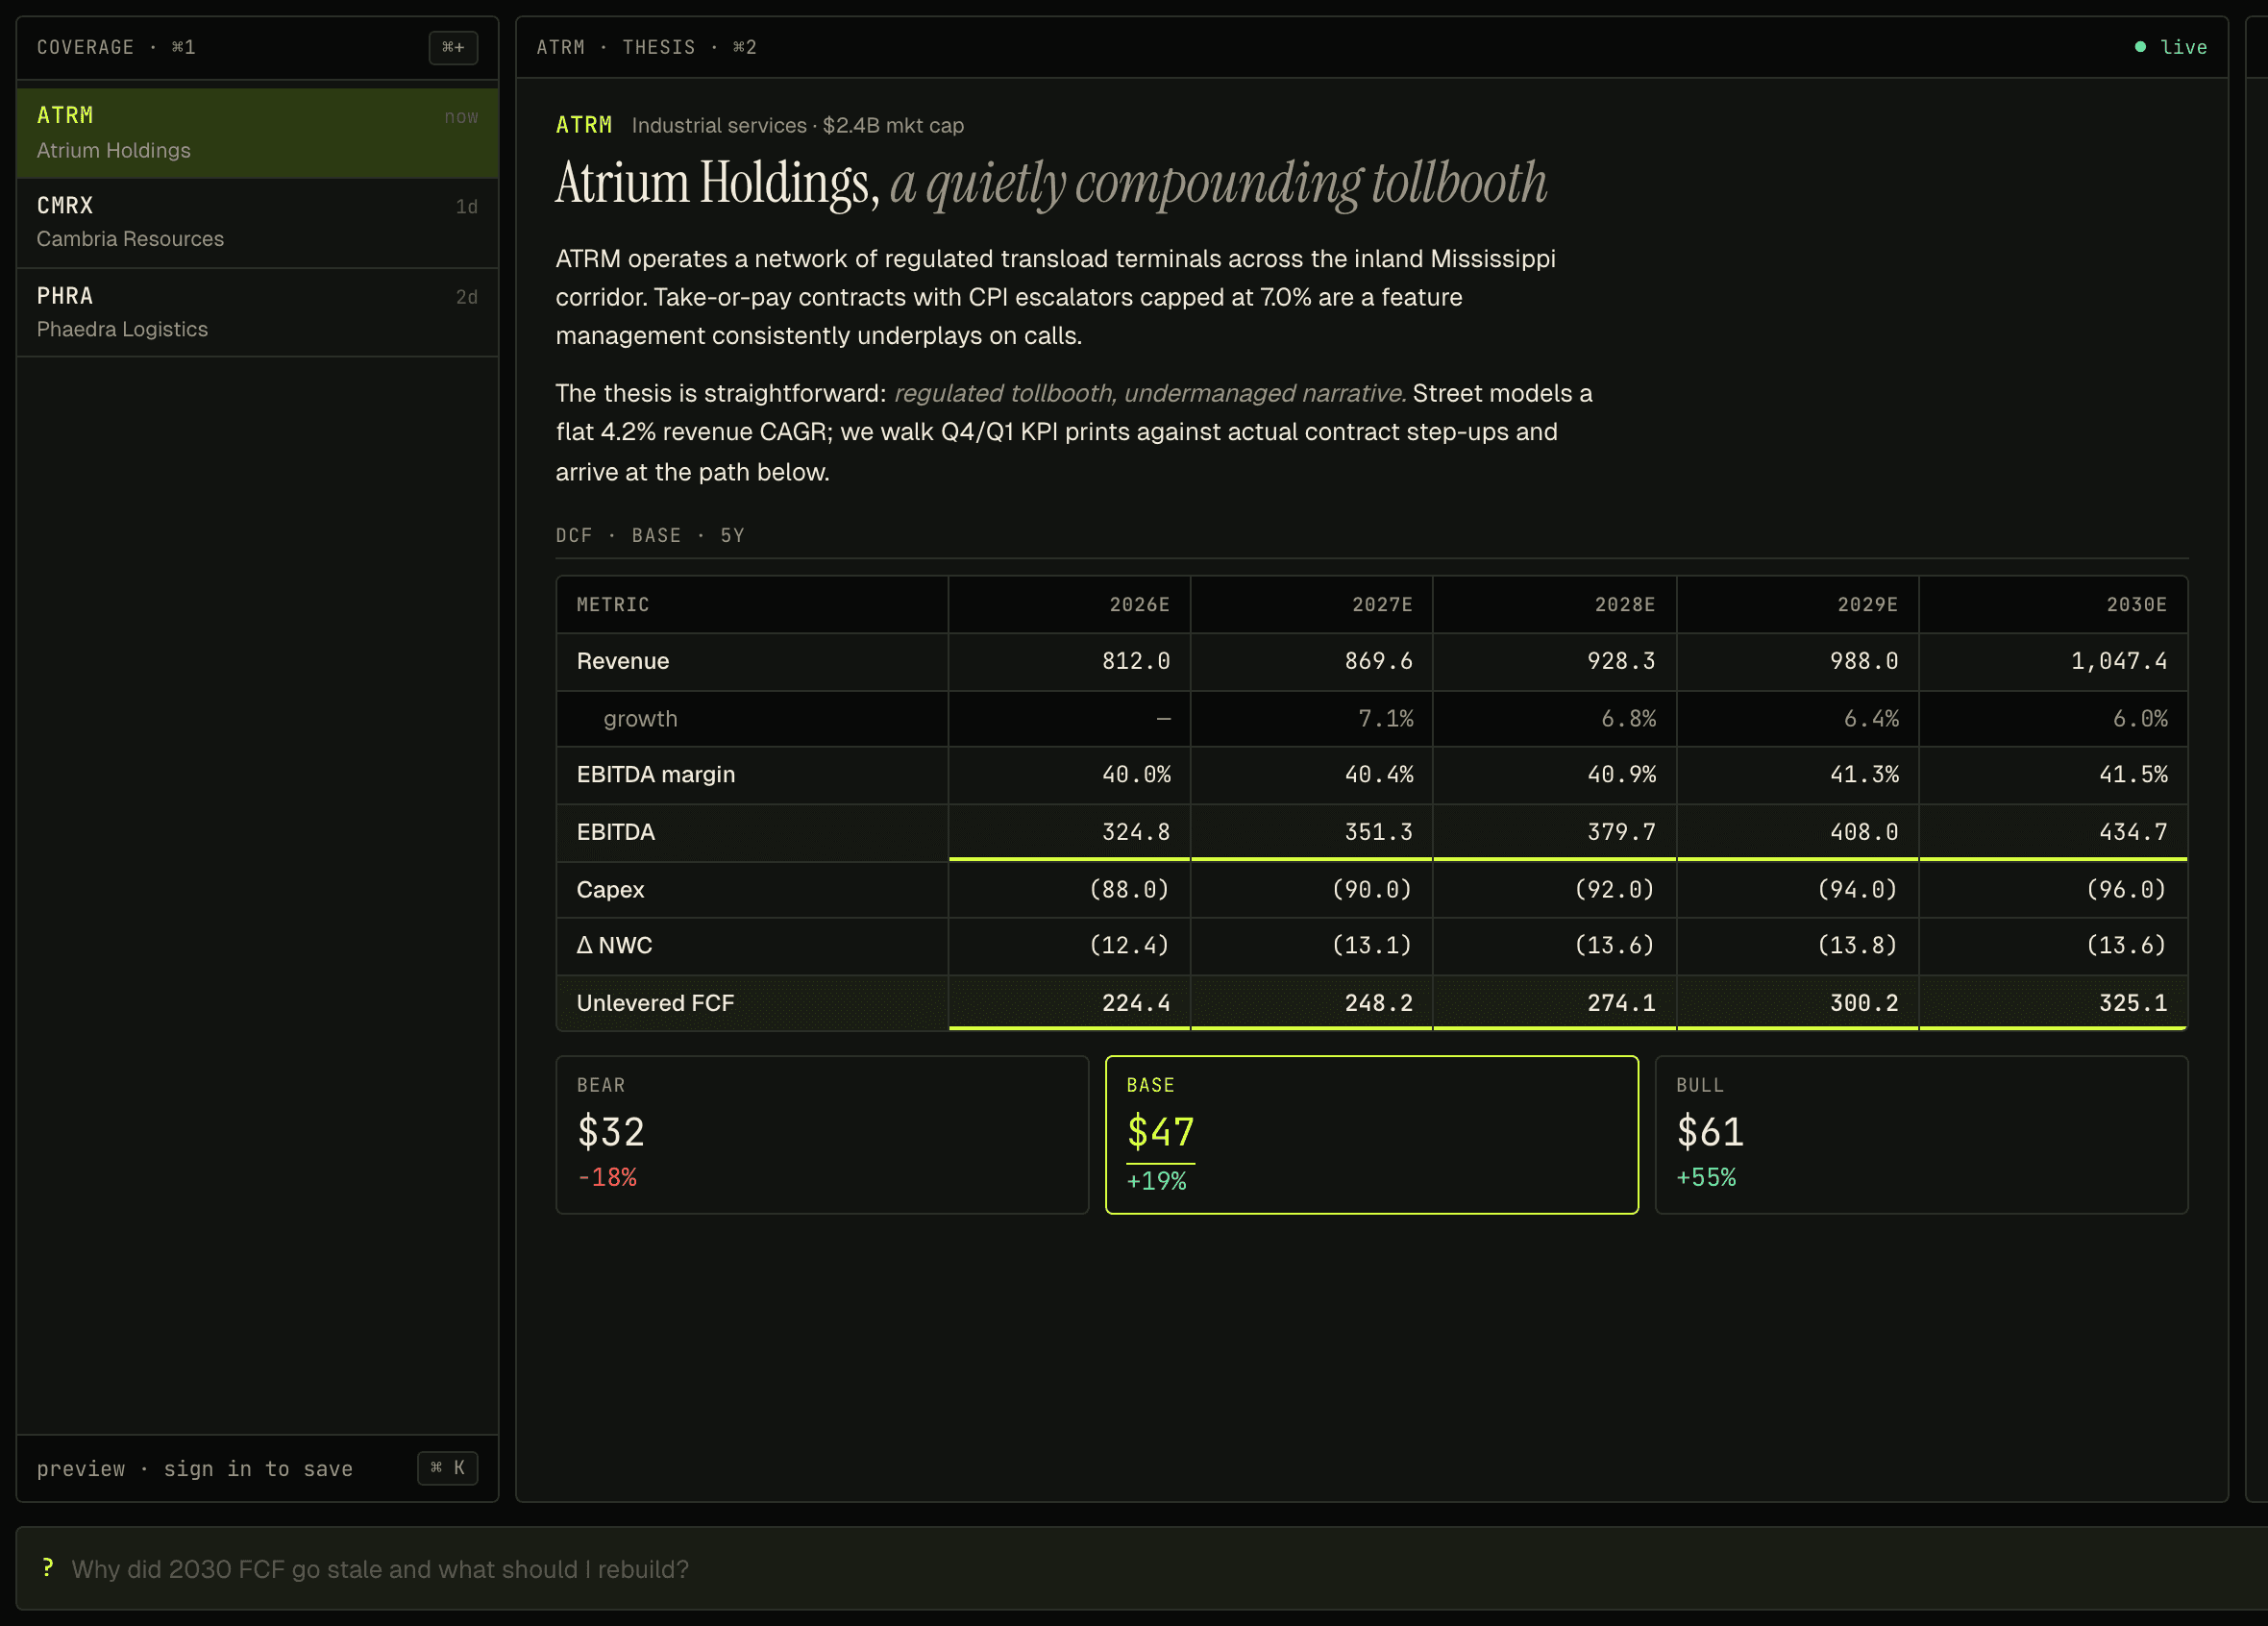
Earnings hit. Paste the new revenue forecast and updated guide; the agent writes each period back into the model and re-runs the DCF. Every value lands as a cell with provenance, so “what moved between yesterday's run and today's” is one prompt away. The chore that used to eat the morning is a few prompts and a sanity-check.
Pull a section of a filing into a cell.
Ask for the segment-revenue table from the latest 10-Q and the agent fetches the filing, excerpts the section, and writes the values into the cells you point at — with a source link back to the filing. The reading-and-retyping loop the analyst runs every week collapses to a prompt.
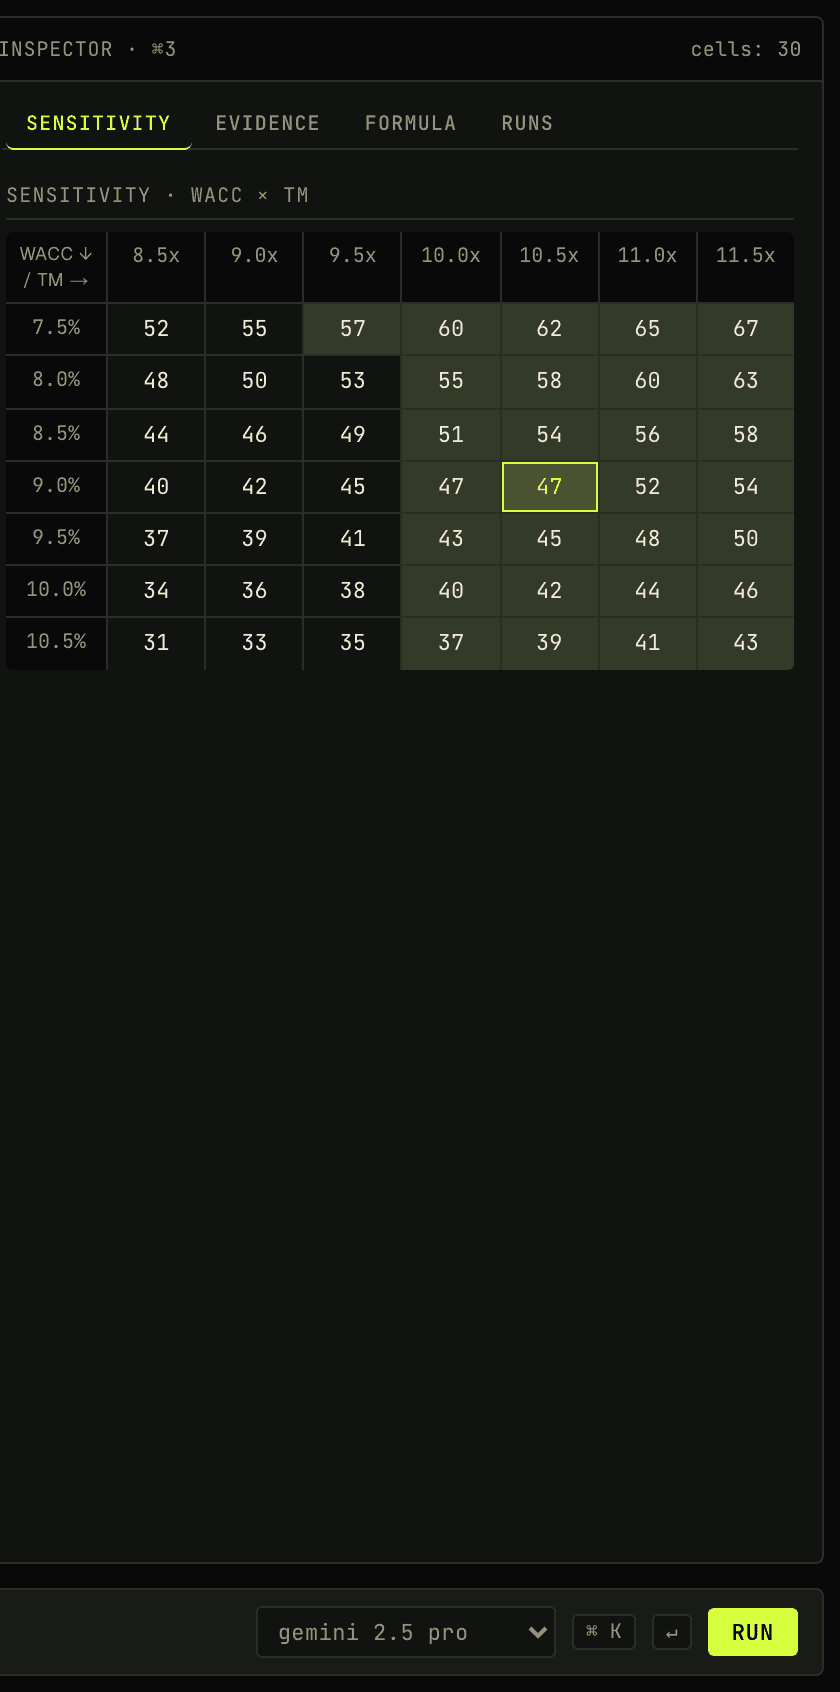
Sensitivity analysis without rebuilding.
A 121-cell grid of DCF runs across two assumptions — typically WACC × terminal multiple, swap which axis is which with one click. Renders inline; no modal, no separate tool. The analyst sees where the thesis is robust and where it's pinned to a single cell. No model rebuild required.
Export a workbook your PM can read.
One prompt ships the cell graph as a styled .xlsx — formulas where they make sense, headers and formats already wired. The PM opens it in Excel and the workbook reads as if a person built it; nothing in the file betrays that an agent did the typing.
Read-only and unauthenticated. Open it in a tab; click into a cell; ask the agent something.